Make Better Decisions
Data Visualization Benefits with Royal Cyber
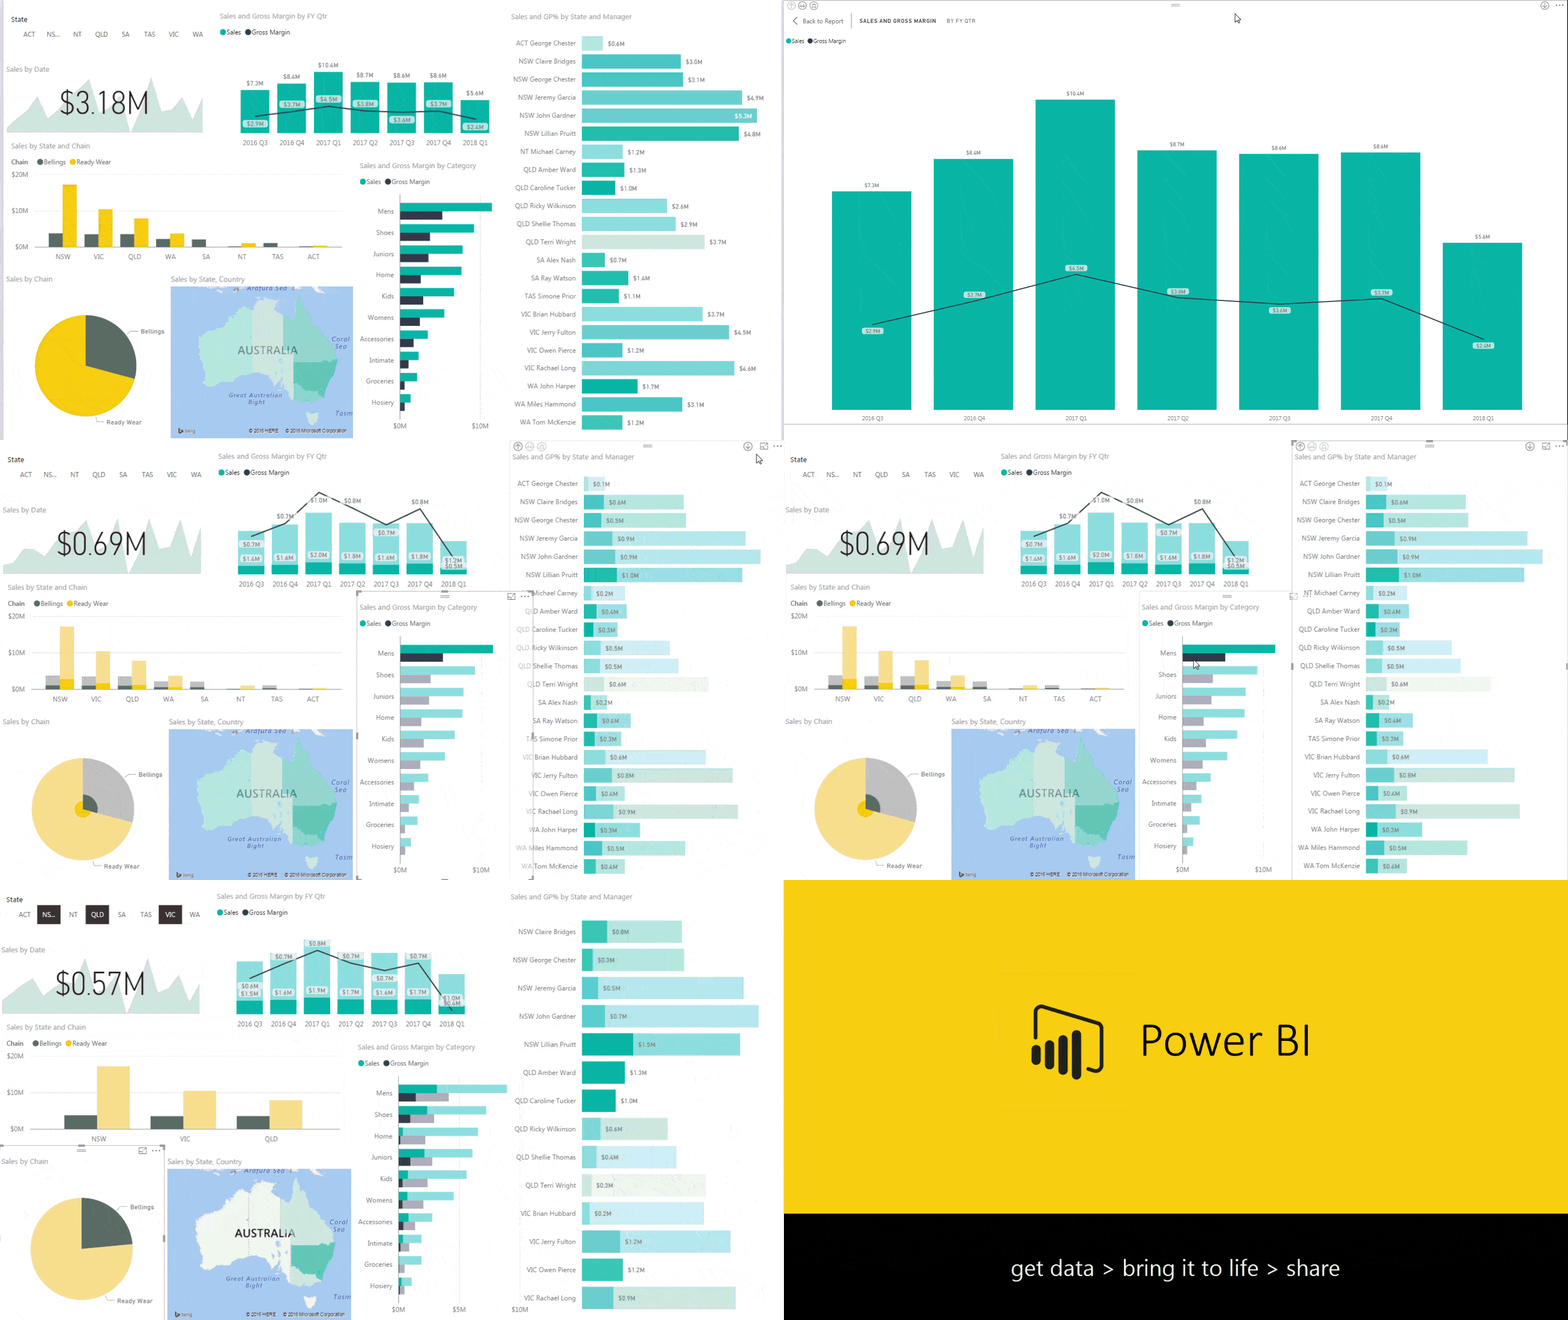
- Effective data visualization with accurate analytics
- Customized data visualization services tailored to your needs
- Multiplatform delivery with data visualization dashboards
- Transforming spreadsheets into interactive visuals
- Improved decision making and increased ROI
- Ease of use and free of IT dependancy
Data Visualization Services Include
Data Visualization Use Case
Predictive Modeling Technology Optimizing Healthcare Marketing
Introduction:
Automation and semi-automation in predictive analytics were demanded with a high degree of reliability and validity to balance volume-to-value-based service delivery and marketing approaches to grow its business and engagement.
Challenge:
- The company’s resources limited their predictive modeling output, not enough to support their growing base of healthcare providers.
- The team spent weeks on model building & validation.
- Their existing solution was not optimal to handle the complexity of the data needs.
Solution:
- The Data Robot platform, hosted on Amazon Web Services (AWS), allowed for automation and semi-automation of the predictive analytic processes, and speeding model building.
- The volume of models the company is creating has increased by 10 times, more valid and statistically reliable.
- The quality of cross-sell, up-sell, retention, acquisition, re-acquisition have significantly increased, leading to optimum marketing efforts and an increase in ROI.


